Repository navigation
Plotting on Separate Axes(?) #321
Description
Hi,
I've only just installed Datalab, so maybe this is possible but I'm not finding it. However, is there a way to plot multiple signals on separate axes? I.e. one on top of the other, going down the page, like this (in Labplot)
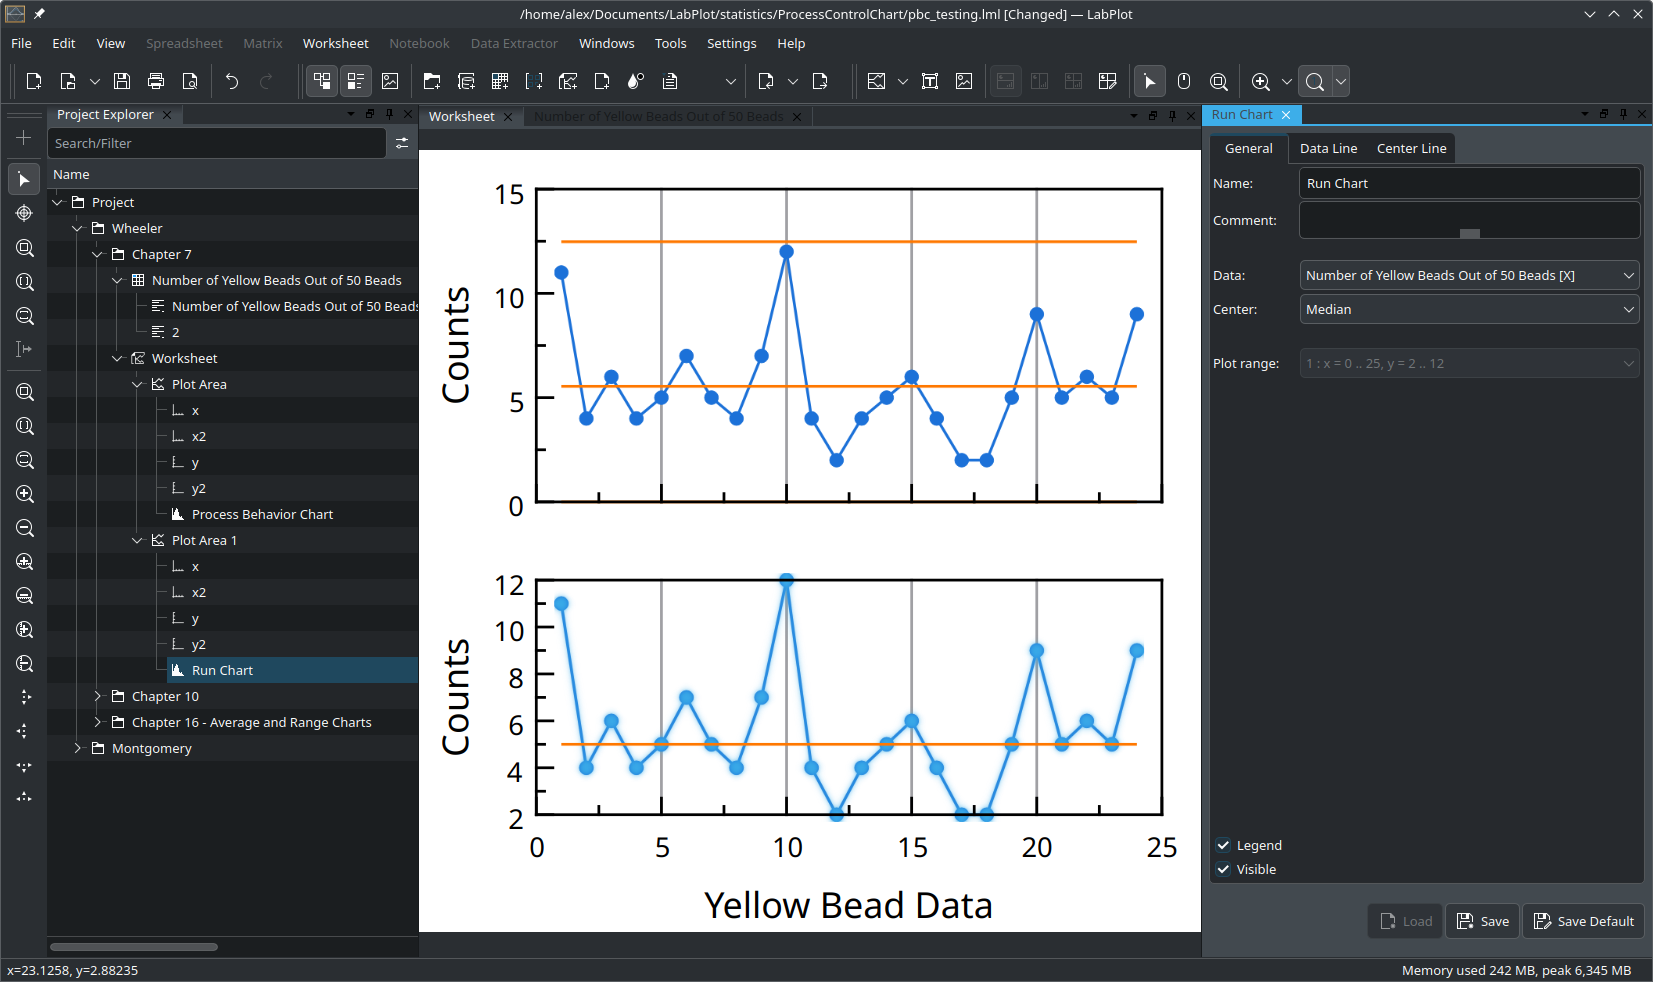
Datalab looks very interesting, but for working with time-series data or signal processing (EEG for me), this is a pretty fundamental requirement to be able to use it. If I took a Hilbert transform for example, it would make sense to place the amplitude on the same axes as the input signal, as it should envelope it, but the angle will need to be on a second set of axes or we'll end up with an illegible mess.
It looks like I can do this in code from PyPlot (I want radio buttons etc. so I can simply disable and re-enable some of the plots; I end up wasting a lot of time plotting and replotting when what's much better is to use code to generate data, throw my data at something, and have a nice UI then to decide how it's all rendered and play around, so was pleased to learn of the existence of datalab) but unless I'm just not seeing it, this would be a very useful addition to datalab, and I expect a necessary must-have for most people working with different datastreams that are synchronised across time or space.
Thanks!
Activity
ThomasMalletCodra commentedon May 21, 2026
Hi @stellarpower !
Thank you for your contribution.
Time-series data or signal processing with a dedicated UI in DataLab is one of the most asked features.
In fact, your idea could be super nice indeed.
So we will take into account your idea when we start the development.
PierreRaybaut commentedon Aug 1, 2026
This need has also been taken into account for the Web edition and is now tracked in DataLab-Platform/web#16.
PierreRaybaut commentedon Aug 1, 2026
Done in DataLab Web! This feature is now implemented in the
developbranch, with Overlay, Vertical, and Horizontal layouts and synchronized compatible X axes.See the animated GIF demo in DataLab-Web issue #16.
stellarpower commentedon Aug 5, 2026
Prefect, thank you!! It would also be nice to be able to tune and have some plots with shared axes, and some plots on separate - but that's perhaps a larger additional enhancement. I haven't used datalab again in a bit but look forward to this next time I do. I also am looking at starting to do some custom stuff with Qt for a slightly different usecase in the coming while, but would happily add additional features and food for thought that come up here/on a separate issue. There are various features from different libraries/applications and different domains also that are of interest.
PierreRaybaut commentedon Aug 6, 2026
Thanks @stellarpower — this follow-up has now been implemented for DataLab Web and is tracked in the reopened Web issue #16.
The new Organize axes... dialog lets users keep related signals on the same axis while assigning others to separate axes, in Vertical or Horizontal layouts with compatible X axes synchronized.